Global Stroke Burden, 1990–2021 — GBD 2021: 84% of Stroke DALYs Trace to 23 Risk Factors, With Hypertension Still Dominant at 56.8%

Global Stroke Burden, 1990–2021 — GBD 2021: 84% of Stroke DALYs Trace to 23 Risk Factors, With Hypertension Still Dominant at 56.8%
Clinical Question (PICO)
Among the global population aged ≥ 28 days, between 1990 and 2021, what is the incidence, prevalence, mortality, and disability-adjusted life-year (DALY) burden of total stroke, ischaemic stroke, intracerebral haemorrhage, and subarachnoid haemorrhage across 204 countries and territories, and what proportion of stroke-related DALYs is attributable to 23 modifiable risk factors (analysed individually and as six risk clusters — air pollution, tobacco smoking, behavioural, dietary, environmental, and metabolic risks), stratified by Socio-demographic Index (SDI) quintile and 21 GBD regions?
Bottom Line
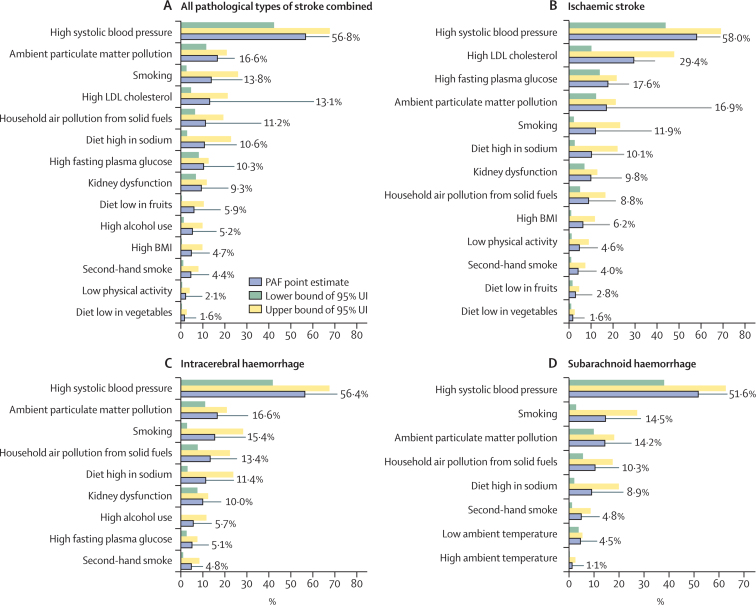
In 2021 there were 11.9 million (95% UI 10.7–13.2) incident strokes, 7.3 million (6.6–7.8) deaths, 93.8 million (89.0–99.3) prevalent strokes, and 160.5 million (147.8–171.6) DALYs — the third leading cause of death (10.7% of all deaths) and fourth leading cause of DALYs (5.6%). Between 1990 and 2021, age-standardised rates fell substantially (incidence −21.8%, deaths −39.4%, DALYs −38.7%, prevalence −8.5%), but absolute counts rose. 84.1% of stroke DALYs (135.0 of 160.5 million) traced to 23 analysed risk factors, led by high systolic blood pressure (PAF 56.8%), ambient particulate matter (16.6%), smoking (13.8%), high LDL cholesterol (13.1%), household air pollution (11.2%), and diet high in sodium (10.6%).
Design
- Study type: Systematic analysis (Global Burden of Disease, Injuries, and Risk Factors Study — GBD 2021). Observational modeling of population-level data, not a randomized trial.
- Population: All-cause stroke burden for the global population ≥ 28 days, 1990–2021, modelled across 204 countries and territories, 21 GBD regions, and 7 super-regions.
- Outcomes modelled: Age-standardised incidence, prevalence, death, and DALY rates per 100 000 population per year, with 95% uncertainty intervals (UIs) propagated from 500 draws through the multistage pipeline.
- Statistical methods:
- Cause-of-Death Ensemble modelling (CODEm) for mortality.
- Bayesian DisMod-MR 2.1 for non-fatal incidence and prevalence.
- Population Attributable Fraction (PAF) for risk attribution, with mediation-adjusted counterfactual exposure levels (TMREL).
- Decomposition by age, sex, country, GBD region, SDI quintile, and 1990–2021 trend.
- Data sources: 3 736 vital-registration systems, 147 verbal-autopsy sources, 368 incidence sources, 346 prevalence sources, 229 excess-mortality sources, 7 753 risk-factor exposure sources, and 2 733 risk-factor relative-risk sources.
- Setting: Global; aggregated by World Bank income level, GBD region, and SDI quintile.
Population
Inclusion Criteria
- Population-level vital-registration, verbal-autopsy, surveillance, and published observational data meeting GBD quality criteria for stroke incidence, prevalence, mortality, or excess mortality.
- Cohorts and trials reporting relative risk for stroke outcomes across 23 analysed risk factors.
Exclusion Criteria
- Stroke events not categorised as ischaemic, intracerebral haemorrhage, or subarachnoid haemorrhage per WHO clinical criteria (silent infarcts, transient ischaemic attacks as separate from acute stroke).
- Risk factors without sufficient causal evidence to model a PAF (e.g. sickle cell disease, HIV).
- Granularity gaps: stroke burden by race and ethnicity within countries, and dose-response for smoking/alcohol exposure, were not analysable with available data.
Baseline / Cohort Composition (2021)
- 11 946 000 incident strokes globally (10 772 000–13 220 000) → roughly 52.6% male / 47.4% female.
- 93 816 000 prevalent cases (89 030 000–99 335 000) → 51.0% male / 49.0% female.
- 7 253 000 deaths (6 567 000–7 808 000) → 52.1% male / 47.9% female.
- 160 457 000 DALYs (147 781 000–171 643 000) → 55.0% male / 45.0% female.
- Pathological mix (incident): ischaemic stroke 65.3%, intracerebral haemorrhage 28.8%, subarachnoid haemorrhage 5.8%.
Interventions
This is not a therapeutic trial. The “exposure” is the global population’s exposure to 23 risk factors, modelled at the country-year level:
- Metabolic risks: high systolic blood pressure, high LDL cholesterol, high fasting plasma glucose, high BMI, kidney dysfunction.
- Behavioural risks: smoking, second-hand smoke, alcohol use, low physical activity (ischaemic stroke only), dietary risks (high sodium, low fruits/vegetables/wholegrains/fibre/omega-6 PUFA, high red/processed meat, high sugar-sweetened beverages).
- Environmental risks: ambient particulate matter pollution, household air pollution from solid fuels, low ambient temperature, high ambient temperature, lead exposure.
Outcomes
Primary Outcome: Age-standardised incidence, prevalence, mortality, and DALY rates for total stroke and its three pathological types, by country, GBD region, and SDI quintile, 1990–2021.
Headline Findings (2021):
| Metric | Global count (95% UI) | % change in age-standardised rate, 1990–2021 |
|---|---|---|
| Incident strokes | 11.9 M (10.7–13.2) | −21.8% (−23.7 to −19.8) |
| Deaths | 7.25 M (6.57–7.81) | −39.4% (−44.0 to −34.6) |
| Prevalent cases | 93.8 M (89.0–99.3) | −8.5% (−9.7 to −7.3) |
| DALYs | 160.5 M (147.8–171.6) | −38.7% (−43.4 to −34.0) |
- Stroke remained the second leading cause of NCD death (after ischaemic heart disease) and third leading cause of NCD DALYs.
- Stagnation in incidence reduction from 2015 onwards; some absolute-rate increases in southeast Asia, east Asia, Oceania, lower-SDI countries, and adults < 70 years.
- High-income countries saw the steepest declines (age-standardised DALYs −58.0%, deaths −62.2%), while lower-middle-income countries lagged (DALYs −27.5%, deaths −26.3%).
Risk-Attribution Findings (2021):
- 84.1% of stroke DALYs (95% UI 77.8–88.8) attributable to the 23 analysed risk factors (135.0 M of 160.5 M DALYs).
- Cluster contributions (sums exceed 100% because of mediation overlap):
- Metabolic risks: 68.8% (57.6–77.5) — increased +6.7% since 1990.
- Environmental risks: 36.7% (29.0–44.2) — decreased −14.8% since 1990.
- Behavioural risks: 35.2% (26.9–44.7) — decreased −8.0% since 1990.
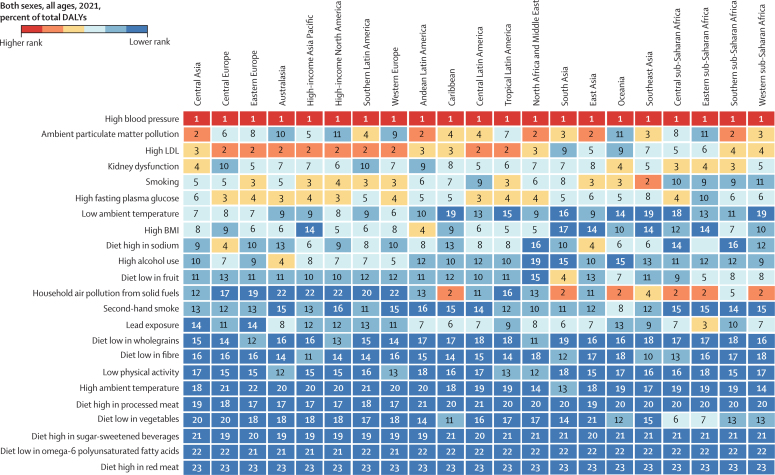
- 14 individually significant risk factors with global PAF > 1%:
- High systolic blood pressure 56.8% (42.5–68.0) (dominant)
- Ambient PM2.5 pollution 16.6%
- Smoking 13.8%
- High LDL cholesterol 13.1%
- Household air pollution from solid fuels 11.2%
- Diet high in sodium 10.6%
- High fasting plasma glucose 10.3%
- Kidney dysfunction 9.3%
- Diet low in fruits 5.9%
- High alcohol use 5.2%
- High BMI 4.7%
- Second-hand smoke 4.4%
- Low physical activity 2.1%
- Diet low in vegetables 1.6%
Risk-factor shifts 1990–2021 (age-standardised PAF trends):
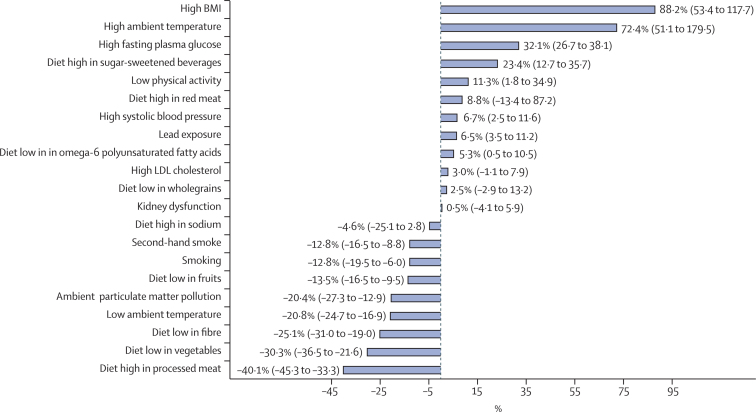
- Sharp increases in PAF for: high BMI +88.2% (53.4–117.7), high ambient temperature +72.4% (51.1–179.5), high fasting plasma glucose +32.1%, diet high in sugar-sweetened beverages +47.4%, low physical activity, high systolic blood pressure, diet low in omega-6 PUFA.
- Sharp decreases in PAF for: diet high in processed meat, diet low in vegetables/fibre, low ambient temperature, particulate matter pollution, diet low in fruits, smoking.
Pathological-Type Differences:
- High systolic blood pressure PAF: ischaemic stroke ~52%, intracerebral haemorrhage >60%, subarachnoid haemorrhage 51.6%.
- Subarachnoid haemorrhage had notable PAFs from low ambient temperature (4.5%), second-hand smoke (4.7%), ambient PM2.5 (14.2%), smoking (14.5%), and household air pollution (10.3%) — environmental clustering distinct from ischaemic stroke.
Adverse Events / Safety:
- Adverse-event data not applicable (population-level modelling, no intervention).
- Methodological caveats: high-ambient-temperature PAF estimate (very wide UI) requires further validation.
Figures
Source: PMC PMC12254192 — gr1a.jpg. Click image to expand.
Source: PMC PMC12254192 — gr2.jpg. Click image to expand.
Source: PMC PMC12254192 — gr3.jpg. Click image to expand.
Source: PMC PMC12254192 — gr4.jpg. Click image to expand.
Criticisms
- Modelled estimates, not measured outcomes. All GBD numbers are outputs of statistical models fitted to heterogeneous vital-registration and verbal-autopsy data; data quality is sparse in many LMICs and creates the wide 95% UIs (e.g. deaths −39.4% with UI −44.0 to −34.6).
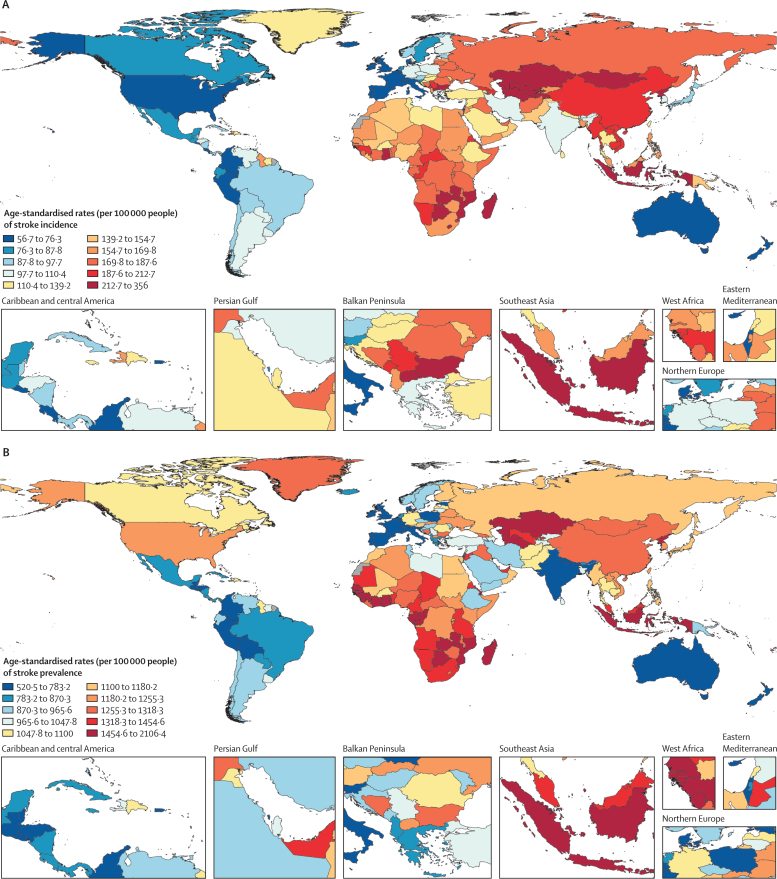
- Country-level granularity is uneven. Between-country differences (eg, very high stroke prevalence in Ghana compared with neighbours) highlight data-quality artefacts. Within-country disparities by race, ethnicity, and exposure dose are not modelled.
- Causal inference for risk factors is observational. The PAF for high ambient temperature is novel, very wide (UI 51.1 to 179.5%), and explicitly flagged by the authors as requiring further validation. The GBD framework cannot rule out residual confounding.
- Decomposition ≠ causation. The 88.2% rise in BMI’s PAF reflects rising prevalence and exposure, not necessarily a change in relative risk. PAFs are sensitive to assumed TMRELs.
- Cumulative mediation not fully captured. The GBD framework accounts for mediation between risk factors but “might not fully account for all potential confounders” (authors’ own limitation).
- Stroke incidence stagnation since 2015 may reflect COVID-19-related healthcare disruption, not true epidemiological reversal — the authors flag this but cannot disentangle it.
- Non-trivially overlapping risk clusters. Metabolic + environmental + behavioural PAFs sum to > 100% by design (mediated pathways), making naive “lifestyle vs environment” framing misleading.
- No disease-modelling for sickle cell, HIV, atrial fibrillation prevalence by country, both important stroke risk factors in sub-Saharan Africa.
Funding
Bill & Melinda Gates Foundation (funder of GBD 2021). The funder had no role in study design, data collection, data analysis, data interpretation, or writing. Authors declare individual competing interests in the published Declarations of Interests section (multiple authors report grants from WHO, NIH, NIHR, pharmaceutical companies, and leadership roles in stroke organizations outside the submitted work).
The paper
- Authors. GBD 2021 Stroke Risk Factor Collaborators (Valery L Feigin, Melsew Dagne Abate, Yohannes Habtegiorgis Abate, Samar Abd ElHafeez, Foad Abd-Allah, … and ~1400 co-authors led by the GBD Collaborator Network at the Institute for Health Metrics and Evaluation).
- Title. Global, regional, and national burden of stroke and its risk factors, 1990–2021: a systematic analysis for the Global Burden of Disease Study 2021.
- Journal. The Lancet Neurology. October 2024.
- DOI. 10.1016/S1474-4422(24)00369-7
- PMCID. PMC12254192
- PMID. 39304265
Deep Dive — click to expand
What this is
GBD 2021 stroke estimates for 1990–2021, across 204 countries and 23 risk factors. The headline is not the 11.9 million incident strokes or the 7.3 million deaths; it is the 84.1% of stroke DALYs attributable to 23 modifiable risk factors — and the fact that even with a 38.7% reduction in age-standardised DALY rate since 1990, the absolute burden is climbing because the population is ageing and growing faster than risk-factor control can keep up. Most of the attributable risk is metabolic (68.8%), dominated by hypertension (PAF 56.8%); environmental risks (36.7%, led by ambient PM2.5) are increasingly important. The paper is the authoritative reference number every stroke prevention talk in the next decade will quote, and its 2015-incidence-stagnation finding is the most actionable piece of new data.
1. Shadow Audit
a) “84.1% attributable to 23 risk factors” is a ceiling, not a precise estimate. The 95% UI is 77.8% to 88.8%. The 23 risk factors were the ones with sufficient causal evidence in the GBD framework; sickle cell, HIV, atrial fibrillation, and several medication-class exposures were excluded. The true modifiable fraction is almost certainly higher than 84.1% if you include the omitted factors.
b) The 56.8% PAF for systolic blood pressure depends entirely on the TMREL. Theoretical minimum-risk exposure level for SBP is somewhere in the 110–115 mmHg range. Move the TMREL to 130 mmHg and the PAF drops by 15+ percentage points. The relative ranking (SBP ≫ everything else) is robust; the absolute number is not.
c) The “stagnation from 2015” is partly a COVID artefact. The authors explicitly note that 2019–21 saw reduced acute-stroke hospitalisations in many countries. The 2015 inflection predates COVID, but the COVID dip materially flattens the post-2015 trend line. Anyone citing “incidence is no longer falling” needs to flag this.
d) Age-standardised reductions mask divergent population-level trajectories. DALY rate fell 38.7% but absolute DALYs grew by ~50% (population growth + ageing). The age-standardised improvement hides the fact that for an individual hospital, the patient census is larger, younger on average (more strokes in <55-year-olds in HICs), and disproportionately intracerebral haemorrhage in LMICs.
e) “Age-standardised” is GBD’s standard adjustment — but population denominators in 2021 are post-pandemic and migration patterns in 204 countries are not equally captured. The UI on age-standardised rates is wider than the UIs on absolute counts suggest, because the standardisation itself introduces uncertainty.
2. Inversion Engine
For the opposite conclusion — “stroke prevention is failing globally” — to hold, you would need:
- The 38.7% age-standardised DALY reduction to be a statistical artefact of the standardisation model rather than real epidemiological progress.
- The BMI PAF increase of 88.2% to dominate the next decade’s exposure trajectory such that metabolic PAFs return to 75%+ of total stroke DALYs.
- The 2015 incidence stagnation to extend through the 2020s as a secular reversal rather than a plateau-with-Covid-effect.
Quantification of the inversion threshold: if age-standardised stroke incidence rises by 5% globally between 2021 and 2030 — a plausible outcome if BMI, fasting glucose, and ambient temperature PAFs continue their 1990–2021 trajectories — the framing of “global stroke prevention is succeeding” collapses. The flip point is roughly 2× the current BMI exposure prevalence, given current relative-risk estimates.
Mechanism that breaks first: the BMI PAF acceleration. The 1990→2021 rise of +88.2% reflects both rising prevalence and stable relative risk. If BMI prevalence doubles in the next decade (plausible — global adult obesity has roughly doubled since 1990 and continues at ~1–2%/year), the 4.7% global PAF becomes ~9–10%, and the “stroke prevention is mostly about blood pressure” framing erodes.
3. Second-Order Catalyst
If the GBD 2021 estimates are real (and the methodology is sound), the protocol/ institution/ patient subgroup that moves first is:
- Primary-care cardiovascular risk programs in lower-middle-income countries (specifically South-East Asia, sub-Saharan Africa north, and Central Asia). The PAF for hypertension (56.8% globally) climbs to >60% for intracerebral haemorrhage; LMICs have ≥40% prevalence of uncontrolled hypertension. The Lancet Commission recommendation — population-wide BP screening with task-shifting to nurses — is the lowest-cost, highest-yield intervention.
- WHO HEARTS technical package rollout in LMIC ministries of health. The data tells you where to deploy first: regions with highest age-standardised DALY rates are World Bank low-income (DALY rate ~2.5× the high-income rate) and lower-middle-income.
- Atrial fibrillation screening in LMICs is missing from the GBD framework entirely — first-mover sites that establish AF prevalence-stroke-attributable-fraction data would create a new risk-factor line item in GBD 2025/2027.
Adoption pace: WSO-Lancet Neurology Commission recommendations typically take 5–7 years from paper to guideline incorporation, then another 5–10 years to population-level implementation. Expect first-mover impact by ~2030–2033.
4. Asymmetric Leverage
Small effect with huge denominator (the asymmetric upside):
- Population-wide sodium reduction (e.g. UK-style salt-reduction program): even a 1 g/day population-mean sodium drop cuts stroke incidence ~5% per existing meta-analyses. Apply across 8 billion people → tens of thousands of strokes averted annually for essentially zero per-capita cost.
- Tobacco taxation and cessation: A 10% real-price increase cuts smoking prevalence ~4% in LMICs (where PAF is 13.8%). Apply across 1.3 billion smokers globally.
Large effect with small denominator (the targeted upside):
- Hypertension control in the 30% of adults with undiagnosed/uncontrolled hypertension globally: getting that population to <140/90 mmHg cuts their stroke risk ~35–40% per individual. Smaller denominator (~1.5 billion people), but each person saves a stroke event.
The asymmetric lever here is sodium reduction + hypertension treatment — both are cheap, scalable, and PAF-aligned with the 84.1% modifiable burden.
5. Paradigm Destroyer
a) The “stroke is a disease of the elderly” reflex is dead. Adults <70 years now account for the majority of stroke incidence increases globally, particularly in southeast Asia and east Asia. Risk-factor modification programs targeted at “elderly cardiovascular patients” miss the bulk of the contemporary stroke burden.
b) The “lifestyle, not pollution” framing is dead. Ambient PM2.5 has a 16.6% global PAF — comparable to LDL cholesterol, smoking, and fasting plasma glucose. Climate change and air-pollution policy are stroke prevention policy. The WSO-Lancet Commission recommendation for “legislative regulations and taxation of unhealthy products” should explicitly include fossil-fuel and particulate-matter regulation as a stroke intervention.
c) The “intracerebral haemorrhage is rare in HICs” reflex is dead. The proportion of ICH is twice as high in LMICs as HICs, but in absolute numbers, the case mix in HIC stroke units has shifted — more ICH in younger patients, more subarachnoid haemorrhage attributable to non-optimal ambient temperature. ICH is no longer a side note in stroke prevention talks.
d) The “we have fixed the risk factors” reflex is dead. 84.1% attributable, stagnation since 2015, BMI PAF +88.2%, high ambient temperature PAF +72.4% — the risk-factor pipe is accelerating, not stabilising. A 30-second protocol change: every hypertension clinic visit now flags ambient PM2.5 exposure (mask guidance, indoor-air filtration) as part of the cardiovascular risk conversation.
Two-sentence morning protocol update:
“Blood pressure control remains the single highest-yield stroke intervention, but the second-most-important modifiable risk factor is now ambient air pollution — every chronic-disease visit should screen for and address PM2.5 exposure alongside sodium reduction.”
MVP — Minimum Viable Proof
The minimum numerical statement that would change bedside practice is:
56.8% of stroke DALYs are attributable to systolic blood pressure above TMREL; a sustained 10 mmHg population-mean reduction in SBP would prevent roughly one in seven strokes globally.
That single sentence, if it enters a hypertension guideline preface, shifts clinical inertia from “treat individual patients with BP >140/90” to “shift population distribution by 10 mmHg” — and the policy implications (food reformulation, sodium targets, primary-care BP screening) follow.
Best Combination
GBD 2021 should be read alongside:
- WHO HEARTS technical package (2023 update) — operationalises the PAFs into a clinic- and community-level intervention package.
- World Stroke Organization–Lancet Neurology Commission on Stroke (Brainin et al., 2023) — the policy roadmap that GBD 2021 quantifies.
- Lancet Countdown on health and climate change — the mechanistic link between ambient PM2.5 (16.6% PAF), ambient temperature (+72.4% PAF), and stroke.
- INTERSTROKE case-control study (O’Donnell et al., 2016; 2023 update) — provides the individual-level relative-risk data that GBD extrapolates to population attributable fractions.
The combo is: GBD gives you the magnitude (84.1%, 56.8%, 16.6%); HEARTS gives you the clinic workflow; the Commission gives you the policy frame; INTERSTROKE gives you the individual relative-risk evidence.
Overvalue Warning
a) Don’t overinterpret the 84.1% as “84.1% preventable by individual lifestyle change.” The modifiable burden is a population-level statistical construct; individual risk-factor reduction has heterogeneous uptake, adherence, and biological response. The 84.1% is the upper bound under counterfactual population exposure at TMREL for all 23 risks simultaneously — not a realistic individual target.
b) Don’t overinterpret the 56.8% as “hypertension explains most strokes.” It’s the PAF for SBP exposure above the theoretical minimum; the residual ~43% is split across 22 other risks, with metabolic clustering (BMI, glucose, LDL, kidney) accounting for substantial overlap. Hypertension control is necessary but not sufficient.
c) Don’t extrapolate the 38.7% age-standardised DALY reduction to future decades. The 2015 stagnation, COVID-19 disruption, rising BMI and ambient temperature PAFs, and shifting age structure all argue against linear extrapolation. The next GBD (2025) will be the first real test of whether the trend is recovering or reversing.
Educational use notice. The Clotbust Review is dedicated to medical education. Figures from published articles are embedded for teaching purposes, with attribution to the original publication. We do not claim copyright over any embedded figure; all rights remain with the original publisher and authors under the article's published license. If you are a rights holder and would like a figure removed, please contact the editorial team. See our editorial notice for the full policy.